By: Dr. Matt Stockton, Agricultural Economist and UNL-Extension Specialist
& Randy Saner, UNL-Extension Educator
This summary looked at 31 commercial beef cow-calf operations with 100 or more cows. Photo credit Troy Walz.
Benchmarking a cow-calf operation by comparing it to other similar operations provides producers a tool to look at ways they can improve their businesses. This summary looks at 31 commercial beef cow-calf operations with 100 or more cows. The information comes from the 2019 FINBIN database maintained by the University of Minnesota for the states of Nebraska, North Dakota, and South Dakota.
Two primary factors affect profit: revenues and costs. The FINBIN portal divides the 31 ranches into five categories, grouped by profit level: Lowest, Low, Middle, High, and Highest. Each category represents six operations, except for the Highest category, which includes seven. Figure 1 shows each category’s average profit and the average of the five groups is the first bar of the figure. There is a $775.50/cow difference between the Lowest and Highest categories. This difference is driven by both higher costs and lower revenues, providing a basis for discussion.
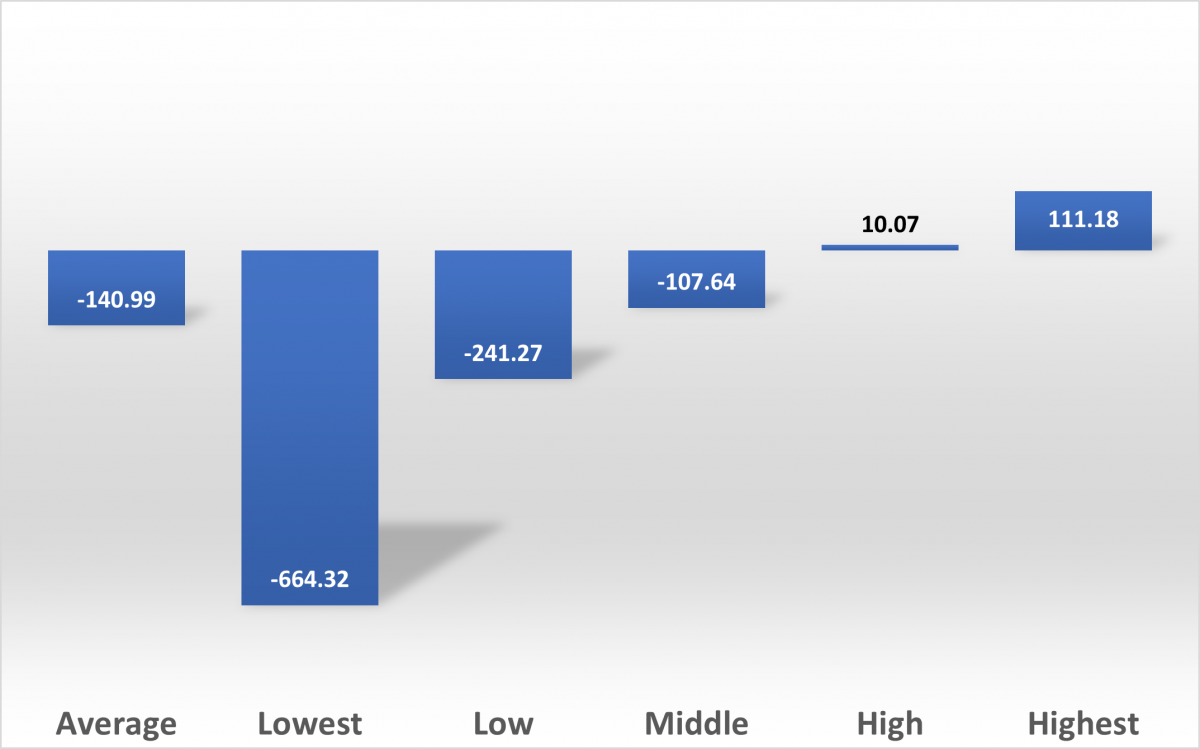
Figure 1. Net returns for each of the five profit levels, the bottom 20 percentile, 21 to 40 percentile, 41 to 60 percentile, 61 to 80 percentiles, and the top percentile.
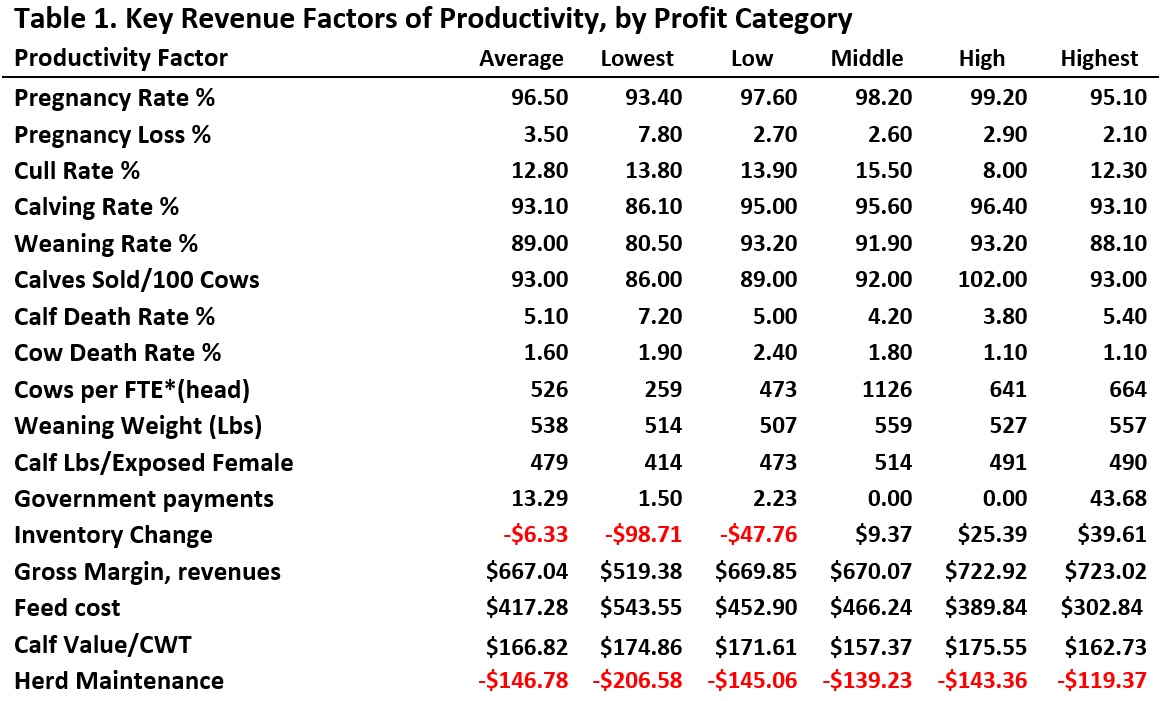
Gross margin is a comprehensive way to account for revenue. These values are listed for each group in Table 1. The factors in this measure relate to the annual increase in value, such as calves sold or transferred to another enterprise (yearling, backgrounding), sale of cull animals (cows, bulls, etc.), government payments, other income, purchased animals, animals transferred in from another enterprise (heifer development, etc.), and a catch-all value for any changes in inventory or expansion. The ‘gross’ in ‘gross margin’ means simply the amount of revenue earned during the year without subtracting any of the direct production costs. Gross revenue from Table 1 varies by about $204/head. The Lowest category was $519.38/head and the Highest group was $723.02/head.
Calf values and cow replacement expenses are the primary drivers of gross margins. Calf values result from both calf weaning weight per cow and the market price received. Replacement value combines cull sales and restocking expenses. Cow inventory is directly related to pregnancy rate, calving rate, death rate, and weaning rate. These factors not only affect the current year’s productivity and profitability, but also the coming year, which is not considered here. The Highest producer group does not have the most pregnancies or number of weaned calves, but still has a slightly higher gross margin than the High group (Table 1, second to last row). This is partly due to the larger government payments, which if subtracted, makes the High group superior in revenue to the Highest group by $43.68/cow. The High group is superior to the Highest group in calf value received per hundredweight (cwt) of calves, per exposed female, also found in Table 1. Both groups achieve almost identical pounds of calf produced per exposed female. The calves average $175.55/cwt for the High ranches compared with $162.73/cwt for the Highest group. This difference is due to many factors unavailable for study, two of the most likely are the size difference at the time of valuation and marketing strategy, and/or luck. In herd maintenance, however, or the buying, selling, and raising of replacement cows, the Highest group has the lowest expense (Table 1). This is consistent with the High profit group’s better production rates, but shows that even with higher replacement numbers, the Highest production group is more cost efficient, making up more than the productive difference.
Cost can be divided into three areas: Direct Cost, Overhead Expense, and Labor/Management. In Figure 2, Total Costs (blue bars) range from $1,183.70/cow to $611.84/cow. Direct Cost (orange bars) comprises the largest portion, representing 64% to 79% of all costs. The top two profit groups average close to 75% of all costs. Overhead Expense (gray bars) average 19.5% of all costs. This leaves Labor/Management cost, which, on average, makes up 8.2% of Total Costs.
From Figure 2, Total Costs (blue bars) decline with each increase in profit rank. The Highest ranked group has the lowest costs. Direct costs do not follow the same pattern. The Middle group has more direct costs than the Low group, followed by lower direct costs for the High and Highest groups. Note the Middle group has the most pounds weaned per cow exposed (most productive), but a higher total cost than either the High or Highest profitability group. Overhead costs decline as profitability increases for all groups. As ranches become more efficient, overhead costs per cow decline, contributing to profit. Management cost is greatest for the Low and Lowest groups but varies among the other three groups. One reason may be that managing the lower profit groups requires more time. Another reason could be that the groups value their time differently. Likely, the lower management costs have more to do with efficiency than valuation. The High and Highest profit herds had about 641 and 664 cows per Full-Time Employee (FTE), while the Lowest and Low profit herds had about 259 and 473 cows per FTE, respectively. Herd size was not the complete answer, however, as the middle group had 1,126 cows per FTE.
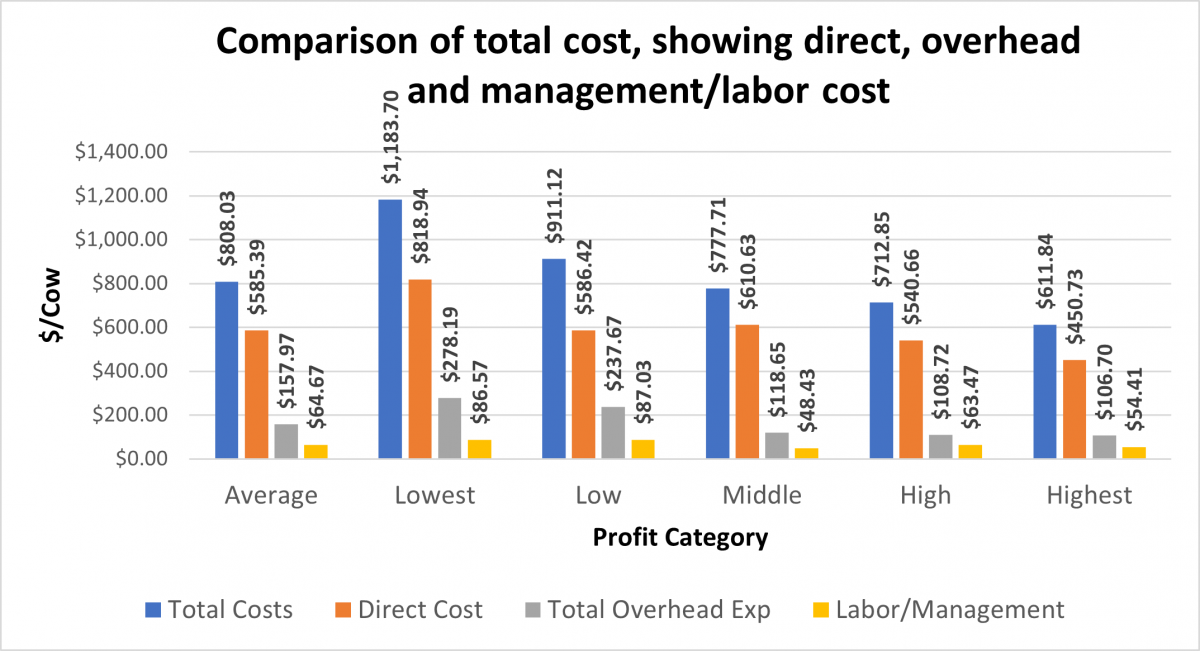
Figure 2. Cost comparison among the primary cost factors.
To really understand what is going on with cost, it would be helpful to see what those costs look like on the basis of dollars spent for every 100 pounds of weaned calf produced (Figure 3). This measure is stated in terms consistent with profitability, rather than pure productivity. Costs generally decline as profits increase. The exception is non-feed cost, which increases more than $2/cow between the Middle and High group, but then declines for the Highest producers. From Figure 2, the direct costs for the Middle profit level are more per cow than the Low profit level. The same direct cost in Figure 3 demonstrates the effect of greater productivity of the Middle group, which overcomes the added feed expense, shown in Figure 2, when compared with the Low group in Figure 3. The blue bar in Figure 3 represents total cost or breakeven price in cwt for calves. The Highest ranches required the least with $124.47/cwt to breakeven, while the High group needed $145.18/cwt, the Middle $151.31/cwt, the Low $192.63/cwt, and the Lowest $285.92/cwt to breakeven. There is much to be gained from this figure, but cost/cwt plays a large role and is key in identifying factors that contribute to profitability.
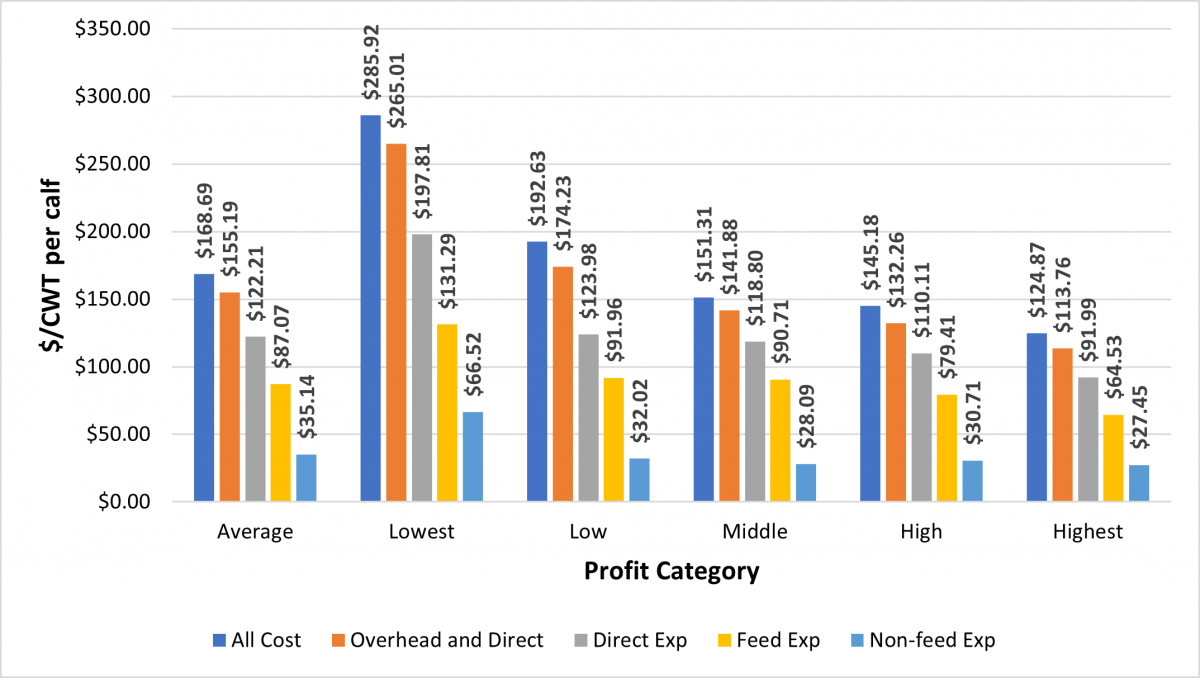
Figure 3. Various cost measures converted to dollars per hundred weight of calf produced per cow exposed.
In conclusion, the Highest profit herds have the lowest per cwt costs. The key to productivity for these operations is the number of calves weaned per cow and calf size. From Table 1, the measure that captures productivity is the pounds of weaned calf per cow exposed. The category with the most pounds per cow is the Middle group, yet they are not nearly as profitable as the High and Highest groups. This shows that productivity alone does not assure profitability. Using the information from Figure 2, the cost difference per cow for the Middle group was $777.71/cow versus the Highest, which was $611.84/cow. The difference between the two costs per cow is $165.87/cow. The difference in the number of cwt of weaned calf per cow is 5.14 cwt against 4.91 cwt, or 0.24 cwt (rounding error). Converting cwt to pounds, 0.24 cwt equals 24 pounds. Dividing the added cost of producing those additional 24 pounds accounts for the cost that the Middle group paid for, over what it cost the Highest group to produce. It cost the Middle profit group $6.91/pound of weaned calf for the additional 24 pounds. From a benchmarking point of view, this shows that the highest profit is not the most productive (heaviest calves). It is always the best-balanced herd that is the most profitable, where costs, productivity, and value play key roles in allocating resources and setting production goals.
Explore more UNL Beef & BeefWatch content here.