By: Dr. Matt Stockton, Agricultural Economist and UNL-Extension Specialist
Collaboratively co-authored with: Abby ShalekBriski, Eric A. DeVuyst, Cheryl S. DeVuyst, Roger Sahs, & Katlin Ramy
UNL Beef Cow-Calf.
Due to the intensive capital requirements and approximate 27-month lag between the initial purchase of heifers and the sale of a calf crop, building a beef cow herd is challenging for beginning and younger cow-calf producers. Here, we describe a three-phase herd building strategy and summarize the results of an economic analysis of the strategy for the Nebraska cattle market.
In Phase I, the producer borrows the necessary funds to purchase weaned heifers. (Alternatively, bred heifers could be purchased to shorten the time to calf sales but at a higher initial cash outlay.) The weaned heifers are placed on pasture and bred around 14-15 months of age. Open heifers are sold as feeder heifers and the revenue is used to pay down debt, as well as feed and veterinary expenses. In Phase II, heifers calve around 24 months of age, and calves are weaned with 70% of heifer calves retained as breeding stock. Steer calves and remaining heifer calves are sold. In Phase III, cows are rebred three months after their first calving and sold about four months later. As second calf heifers (“two-coming-threes”), they are at their highest market value. Open cows are sold assuming cull cow prices. (This is a conservative assumption, as the cull cows are under 30 months of age and qualify as “Grade A” beef.) By selling weaned steer and heifer calves, rebred cows, and culled cows, sufficient cash may be generated to repay debt incurred for the initial heifer purchase and operating expenses.
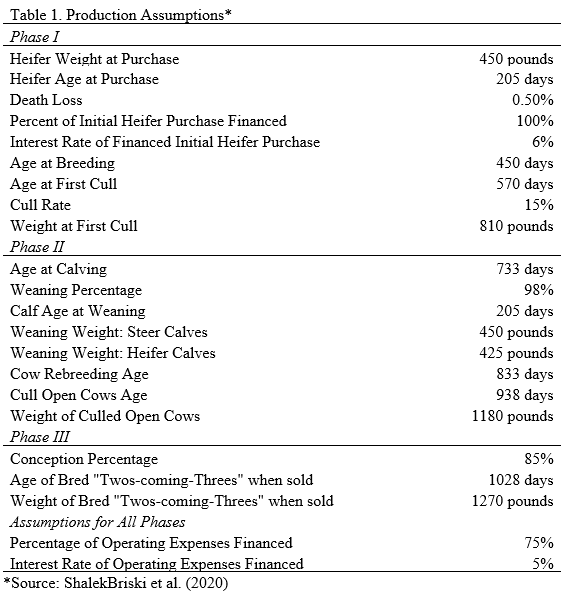
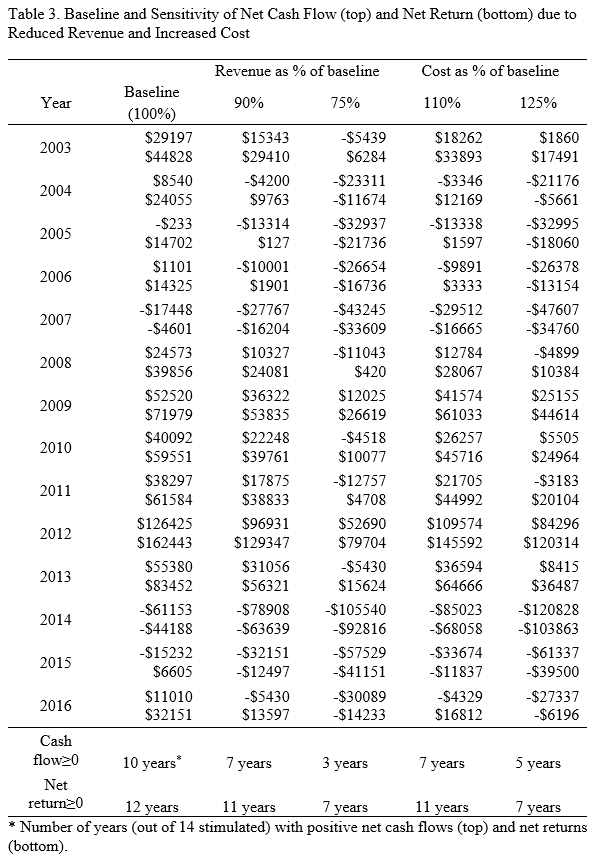
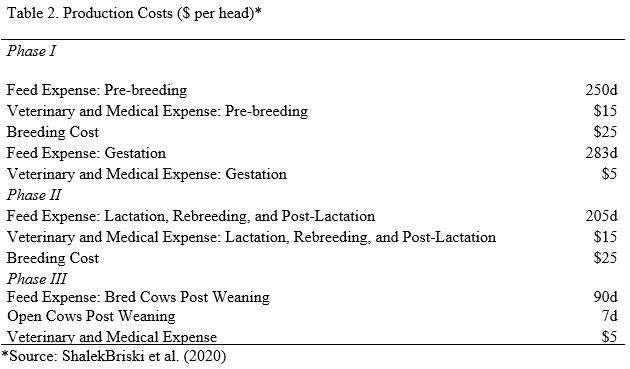
In ShalekBriski et al. (2021), we analyzed this strategy using calf prices, cull cow prices, feed prices, and pasture rental rates for Nebraska. Data from 2003-2019 were used. The production assumptions and production costs are summarized in Tables 1 and 2. Nebraska budgets resulted in positive net cash flows for 10 of the 14 cycles and positive net returns for 12 of the 14 cycles, which is summarized in Table 3. Feed costs were approximated using production practices commonly used in western Nebraska, feed prices, and pasture rental rates varying by year.
Results are encouraging for most cycles except for the 2014 cycle. If heifer calves were purchased in Fall 2014, net cash flow was projected to be negative as feeder calf prices in 2014 were abnormally high. Conversely, cattle prices were lower in 2016 when the steers and heifers from the 2014-purchased heifers were sold. This resulted in negative cash flows for the Fall 2014 cycle.
The abnormally high calf prices in Fall 2014 resulted in high net cash flows and net returns for the cycles beginning in 2012 and 2013. Initial heifer purchases were at lower prices relative to 2014 prices. Sales of calves, rebred cows, and cull cows from the 2012 cycle were made in Fall 2014, resulting in gaudy returns for the 2012 cycle. The 2013 cycle sold cull heifers as feeder heifers into the Fall 2014 market, also resulting in high net cash flow and returns.
Sensitivity analyses were used to evaluate the robustness of the strategy to decreases in herd revenues and increases in heifer purchase cost and operating expenses. The resulting net cash flows and net returns are also reported in Table 3. Revenues were decreased by 10% and 25%. At the 10% revenue reduction level, the strategy is projected to have positive net cash flows and net returns seven and 11 cycles of the 14 cycles. At the lowest revenue level, just 75% of baseline, the strategy is projected to have positive net cash flows and net returns only three and seven cycles of the 14 cycles. Similarly, all costs were increased by 10% and 25%. Net cash flows and net returns are slightly less sensitive to cost increases than to revenue decreases. A 10% increase in costs had projected positive net cash flows and net returns seven and 11 cycles of the 14 cycles. A 25% increase in costs had projected positive net cash flows and net returns five and seven cycles, respectively, of the 14 cycles evaluated.
Along with the high capital outlays and long-term lags, beginning cow-calf producers face other difficulties such as land acquisition, student loan-debt, and knowledge to efficiently run the operation. However, the results of our strategy are encouraging. The timing of purchases relative to large price swings results in either large positive (if bought low and sold high) or negative (if bought high and sold low) net cash flows and net returns. In more “typical” years, building a herd for a first-time cow-calf producer seems financially feasible. Operating debt is incurred but can be paid down through selling cull heifers, steer calves, and open cows. However, individual producers should work with county extension staff and agricultural lenders to evaluate their personal situation before investing in breeding heifers.